Interface Visualization
The Interface Visualization is designed to visualize the binding interface between the specified entities, highlighting the interaction site, type and strength between each interacting pair of residues.
Inputs & Parameters
To use this feature, open the Project Editor and click "New Job" button on the left sidebar. Then click "Interface Visualization" under the "Utils" group to open the job submission page.

First, you need to select the structure to be visualized. You may either:
- click "Select from Project" to choose a structure file in the project. A dialog box will appear for you to select the file.
- click "Select from Viewer" to choose a structure file already opened in the viewer.
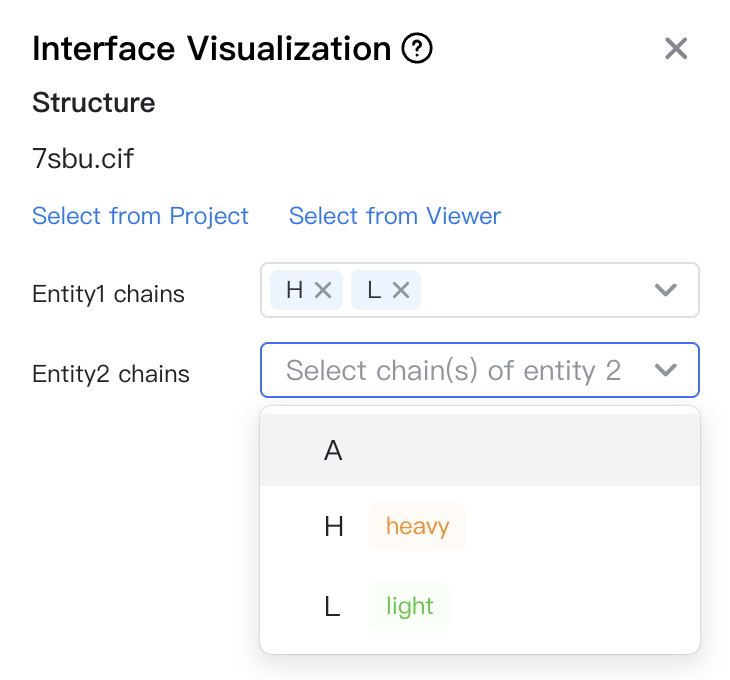
Then, you can select the two entities whose interface will be visualized. Each entity can contain one or more chains. Take PDB 7SBU as an example, there are three chains in the structure: H, L and A. If you want to visualize the VH-VL interface, you can select H and L for the two entities. If you want to visualize the antibody-antigen interface, you can select HL and A for the two entities.
Optional parameters include:
- CDR def.: Numbering scheme used for the definition of CDR regions. Options include "Kabat", "IMGT", "Chothia", or "North". The CDR regions will be colored by distinct colors in the Antibody/TCR color scheme.
Chain Type Identification
GeoBiologics will automatically identify and label the V-domains in the structure, including antibody heavy chain ("heavy"), antibody light chain ("light"), TCR alpha chain ("alpha"), and TCR beta chain ("beta").
Results: Interaction Viewer
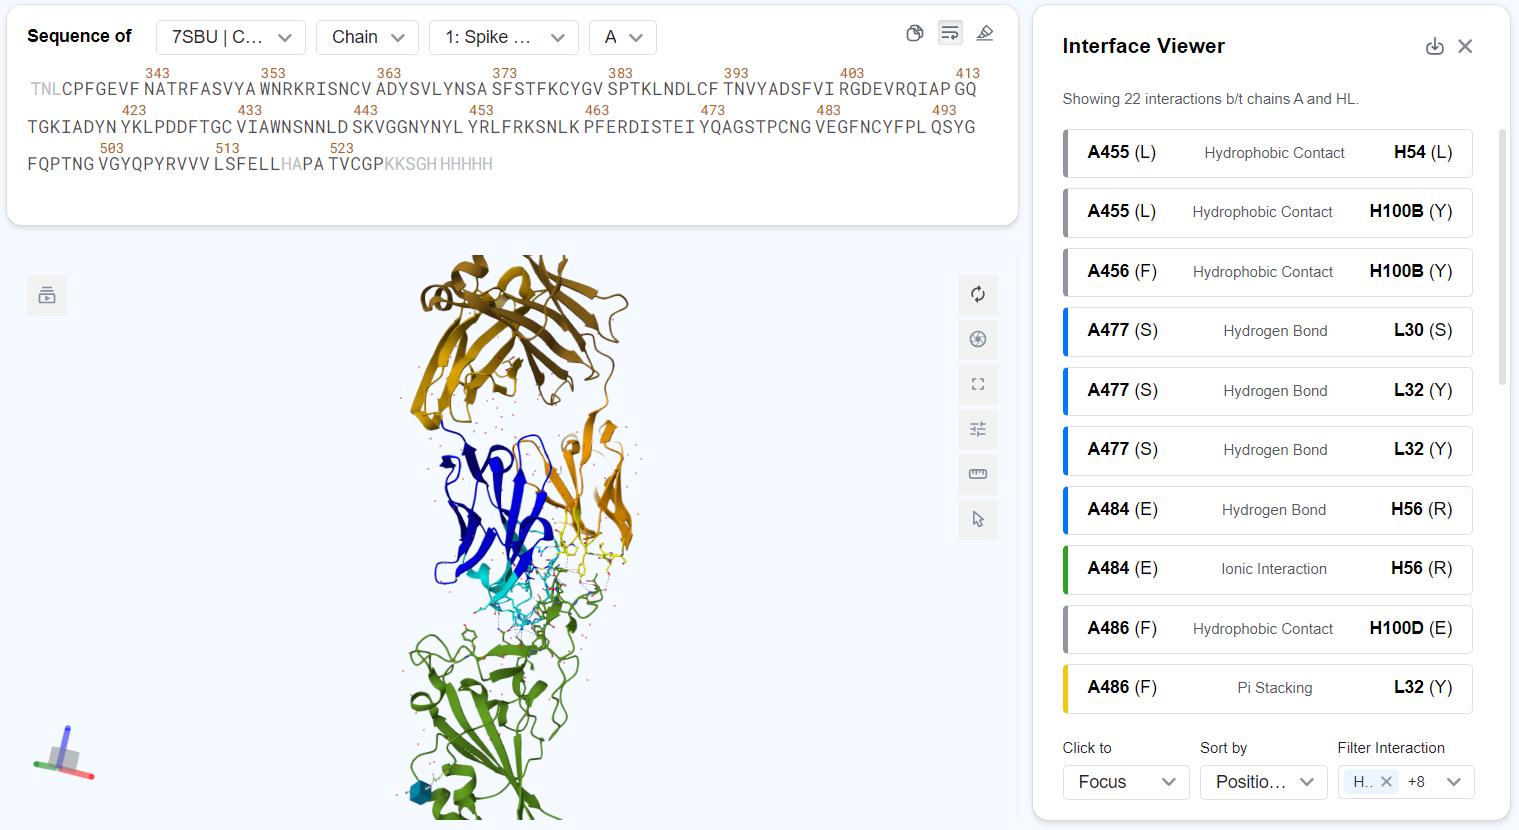
Once the job is submitted, the selected structure will be immediately opened and visualized in the Mol* Viewer, displaying detailed interaction information between the selected entities. An "Interaction Viewer" page will appear on the right side of the Mol* Viewer, showing detailed interaction information of the specified interface.
Structure Objects
You might notice that after submitting this job, the structure in the Mol* Viewer is more detailed than default. This is because additional components and representations have been created for better interfce visualization.

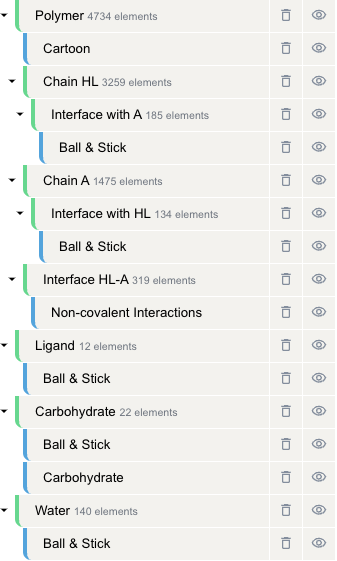
More specifically, assuming you choose to visualize the interface between chains HL and chain A, the following components and representations will appear after you submit the job:
- Polymer (component)
- Cartoon (representation): The default cartoon representation of the polymer
- chain HL (component): all atoms in entity 1 (in this case, the antibody)
- Interface with A (component): entity 1 atoms on the interface with entity 2, i.e. the paratope
- Ball & Stick (representation): shows the paratope atoms in a ball-and-stick model
- Interface with A (component): entity 1 atoms on the interface with entity 2, i.e. the paratope
- chain A (component): all atoms in entity 2 (in this case, the antigen)
- Interface with HL (component): entity 2 atoms on the interface with entity 1, i.e. the epitope
- Ball & Stick (representation): shows the epitope atoms in a ball-and-stick model
- Interface with HL (component): entity 2 atoms on the interface with entity 1, i.e. the epitope
- Interface HL-A (component): interface between the antibody and the antigen, i.e. paratope + epitope
- Non-covalent Interactions (representation): shows the non-covalent interactions between the paratope and the epitope
Interaction Viewer

Overview
The Interaction Viewer page displays a list of interactions between the selected entities. For each interaction, the following information is displayed:
- The two interacting residues' chain IDs, residue IDs and residue types. E.g., "A455 (L)" means that one of the interacting residue is a lysine located at position 455 on chain A.
- The interaction type, denoted by text in the middle of the entry and by color to the left of the entry. Possible interaction types include:
- ■ Hydrophobic Contact
- ■ Hydrogen Bond
- ■ Weak Hydrogen Bond
- ■ Ionic Interaction
- ■ Cation Pi Interaction
- ■ Pi Stacking
- ■ Halogen Bond
- Metal Coordination
Click the button at the top-right corner of the page to download a CSV file storing the full interaction table for further analysis.
Entry details
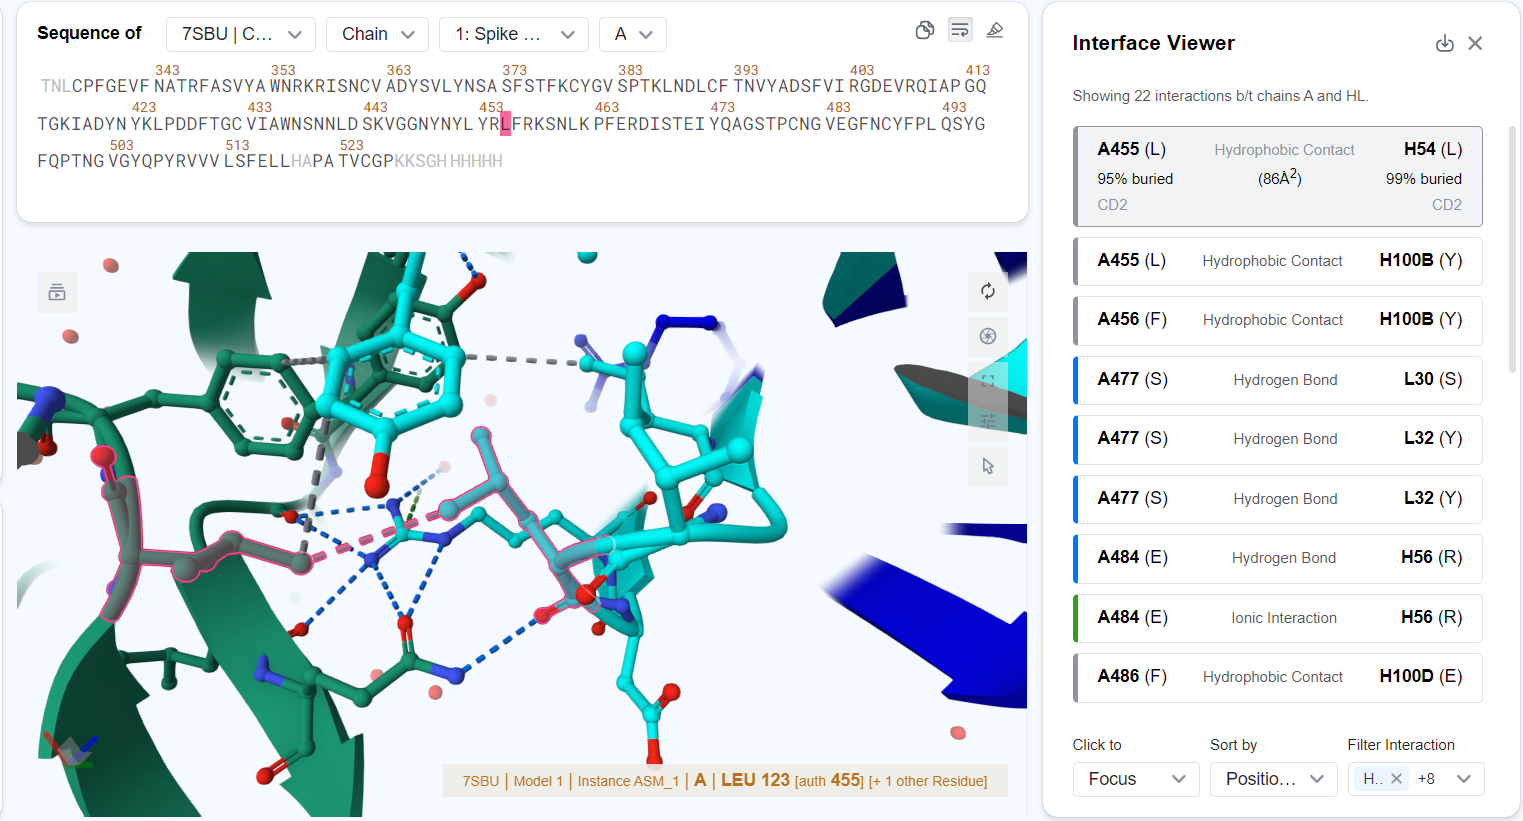
You may click on each entry to view more details about the interaction. After an entry has been clicked:
- The structure viewer will focus to the interacting residues or set the interacting residues as the current selection, depending on the "Click to ..." option selected.
- The entry in the interaction table will expand to also show:
- The percentage of residue surface area buried after binding. E.g., "71% buried".
- The buried surface area of the interacting residues in square angstroms. E.g., "(123 Ų)".
- The interacting atoms of the two residues. E.g., "CD2".

Hovering over an entry highlights the interacting residues in the structure viewer. Hovering over an interaction in the structure viewer will highlight the corresponding entry in the interface viewer.
Page options
You can modify the page display and behavior by changing the page options, located at the bottom of the page:
- Sort by: Choose the criterion to sort the interaction entries.
- Position 1: Sort by the chain-residue IDs of the interacting residues from entity 1.
- Position 2: Sort by the chain-residue IDs of the interacting residues from entity 2.
- Interaction Type: Sort by the interaction type.
- Buried1: Sort by the buried percentage of interacting residues from entity 1.
- Buried2: Sort by the buried percentage of interacting residues from entity 2.
- dASA: Sort by the buried surface area for each interacting residue pair.
- Filter interactions: Choose which interactions are displayed on the page.