Mutation Advisor
Mutation Advisor is an intelligent tool that provides data-driven mutation recommendations to guide protein engineering efforts. This feature is available in Antibody Optimization, Affinity Optimization, and Protein Optimization tasks.
Overview
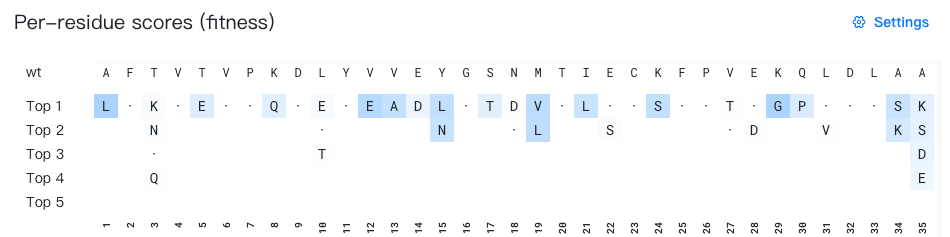
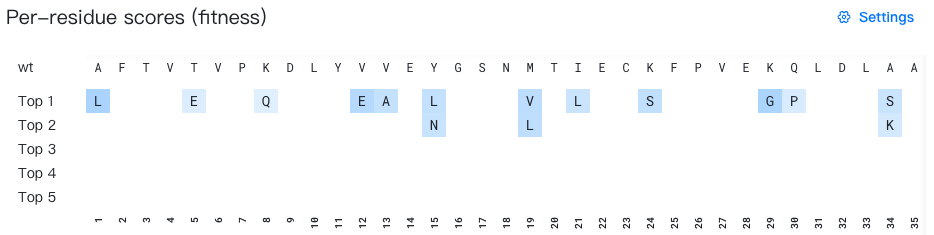
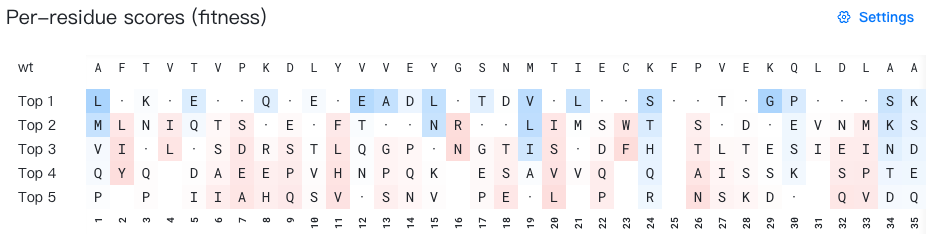
- Top: Displays the wild-type sequence (the initial input sequence before any mutations).
- Bottom: Displays the sequence index (1-based numbering).
- Middle: Display the top 5 mutation suggestions for each position. When the wild-type residue appears among the top 5 predictions, it is shown as "·" for easy identification. All residues are colored according to the selected background color data source.
What does "mutation suggestions for each position" mean?
The top-k mutation suggestion for position p represents the k-th highest-ranked residue predicted by the AI model for that specific position.
For example, in the figure above, to generate mutation suggestions for position 3, the AI model evaluates which residues would be most favorable at that position based on the surrounding wild-type sequence context. In the figure above, the top 4 predictions for position 3 are K, N, T, and Q. Since T is the wild-type residue at this position, it is displayed as "·" instead.
Important: Each row represents ranked alternatives for individual positions independently. The residues in a single "top-k" row do not constitute a complete sequence variant.
Display settings

You can click the ![]() button to open the settings window and configure the following "Mutation advisor" options:
button to open the settings window and configure the following "Mutation advisor" options:
Background color data source
The background color of each mutation suggestion can be based on two different metrics:
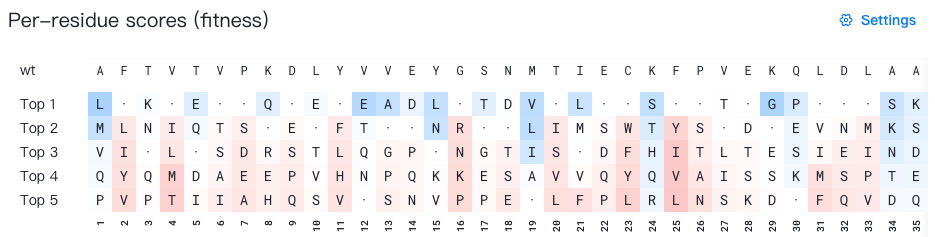
- Raw score (default): The raw prediction score for each residue at each position. Higher positive scores typically indicate better performance, while negative scores indicate worse performance. A notable exception is Affinity Optimization, where more negative \(\Delta\Delta G_\text{bind}\) values represent stronger binding and are therefore favorable.
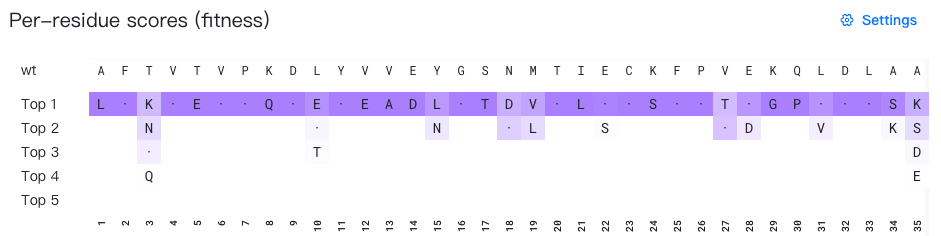
- Per-site probability: The normalized probability for each residue at each position (i.e. site), ranging from 0 to 1. The probabilities for all 20 possible amino acids at a given position sum to 1. Since the probability values are normalized per site, it is not very meaningful to compare probabilities from different sites.
How are per-site probabilities calculated?
Per-site probabilities are computed by applying the softmax function to the raw scores at each position.
Given the raw score \(s_{pi}\) for residue \(i\) at position \(p\), the per-site probability \(p_{pi}\) is calculated as:
where \(T\) is the normalization temperature—a hyperparameter that controls the sharpness of the probability distribution. Higher temperatures produce more uniform distributions, while lower temperatures amplify differences between high and low scores.
This calculation parallels the relationship between energy and probability in statistical mechanics.
How are the colors calculated?
Mutations are colored using a red-white-blue gradient scale:
- Red: Mutations predicted to perform worse than wild-type (usually negative scores)
- White: Neutral mutations (score ≈ 0)
- Blue: Mutations predicted to perform better than wild-type (usually positive scores)
The color intensity scales differently for positive and negative scores, with different rates of color change per unit of score to optimize visual discrimination.
![]()
Mutations are colored using a white-to-purple gradient scale, where color intensity increases with per-site probability.
![]()
Display conditions
You can customize which mutations are displayed using three independent filters:
-
Rank of raw scores: Filter mutations by their overall ranking across all positions. Options include:
- "All" (default): Display all mutations
- "Top 10", "Top 20", "Top 50", "Top 100": Display only the top n mutations ranked by raw score across the entire sequence
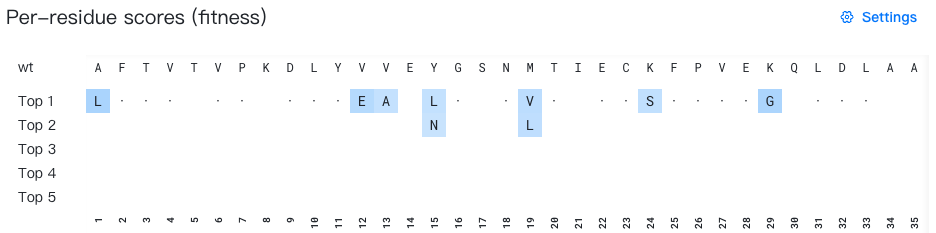
Rank of raw scores: Top 20 -
Per-site probability range: Specify the minimum and maximum per-site probability thresholds. Only mutations with probabilities within this range will be displayed. The default range is 0.01–1.0.
Per-site probability range: 0-1 -
Raw score range: Specify the minimum and maximum raw score thresholds. Only mutations with scores within this range will be displayed. The default range includes all mutations (minimum to maximum).
Raw score range: 1.0-5.3
Warning
Setting restrictive probability or score ranges may filter out the wild-type residue from the display. Under extreme conditions, all mutations may be filtered out.
Normalization temperature
The normalization temperature is a hyperparameter that controls the sharpness of the probability distribution. The higher the temperature, the more uniform the probability distribution. The lower the temperature, the more sharp the probability distribution. The default value is 0.125.
Color ramp range
The color ramp range defines the minimum and maximum values that map to the extreme colors in the gradient:
- For Raw score mode: Sets the score values corresponding to the most intense red (minimum) and most intense blue (maximum)
- For Per-site probability mode: Sets the probability values corresponding to white (minimum) and most intense purple (maximum)
Adjusting this range allows you to enhance contrast for specific value ranges of interest. Values outside the specified range will be clipped to the nearest extreme color.